Deposit Analytics to Design and Build Your Best Checking Lineup
Performance insights on every retail checking relationship
Peer comparison of performance metrics
Determine which customers/members view you as their Primary FI
Data-driven decisions on product changes, account pathing, and pricing
Identify profitability opportunities
Typical Retail Checking Relationship Performance Metrics

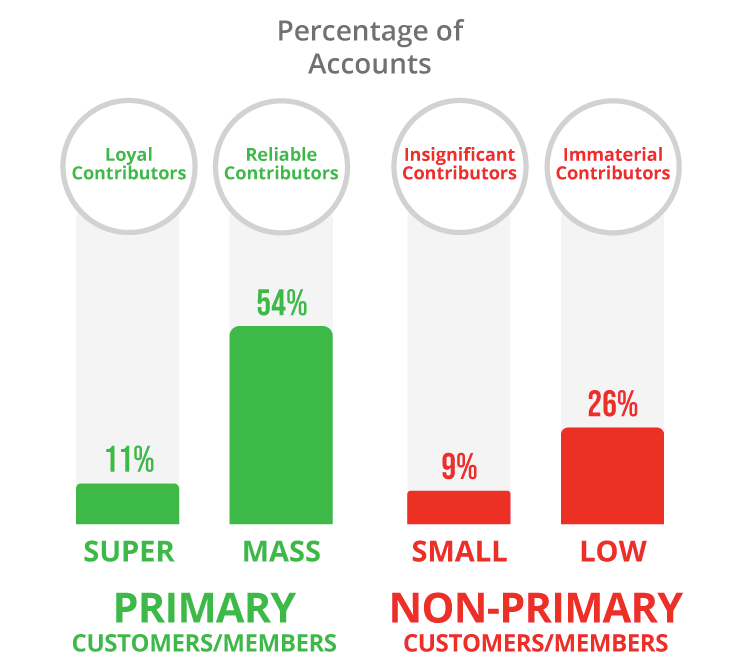
SUPER and MASS relationship segments represent 65% of accounts and consider your FI their Primary FI
SMALL and LOW segments represent 35% and are banking primarily elsewhere

35% of accounts (SMALL and LOW relationships) generate only 3% of revenue – a “drag” on earnings and “strain” on available investment in primary relationships
65% of accounts (SUPER and MASS relationships) generate 97% of revenue – retention is critical

11% of accounts (SUPER relationships) represent 67% of relationship dollars (deposits and loans) – competitors targeting to steal these relationships
35% of accounts (SMALL and LOW relationships) represent 3% of relationship dollars – insignificant relationship with your FI
* Performance Metrics shown are based on our proprietary database of over a billion retail checking performance data points from hundreds of financial institutions.
The CheckingScore Deliverables

Learn how your lineup’s performance benchmarks compare with peers and industry metrics utilizing our database of more than a billion data points.

Determine which customers or members consider you their primary FI (as well as who doesn’t — and is likely banking elsewhere.)

Uncover specific opportunities for lineup simplification, pricing adjustments, product pathing and upgrades, and financial lift to help your FI thrive.

Receive specific actions steps to evolve to a higher-performing and more engaging line-up based on real relationships that generate more revenue.
The CheckingScore Process
Data


Insightful Information


Actionable Game Plan
Day 1
Day 21
Collect easy-to-attain data from your FI
Deposit the data into our householding software engine
Score the relationships to determine which are primary and which are not
Report the analysis results (including peer comparisons, recommendations, and financial forecasting)
Manage customer or member communication and educating employees regarding product and pricing improvements
Ready to get started?
When you’re ready for realistic actionable analysis about how your retail checking line-up is performing and the hidden revenue opportunities, let’s discuss how CheckingScore analytics works for a FI like yours.
